Latitude Property Australia's Quarterly Report (March 2024)
Australian Turn-Key Investment Property Building Costs Per Square Metre & Land Cost By State, Region Per Square Metre.
Welcome to the latest March 2024 issue of Latitude Property’s Quarterly Report. This report provides an in-depth examination of the current Australian real estate market, particularly focusing on the average construction costs per square metre (m²) for various property types and land costs per square metre (m2) for various regions across Australia. Our detailed analysis offers essential information for investors looking to make well-informed decisions in the property sector.
The purpose of the Latitude Property Quarterly Report is to give insights into the fluctuating costs of land and constructing turn-key investment properties throughout Australia.
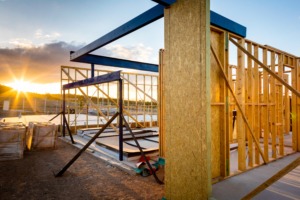
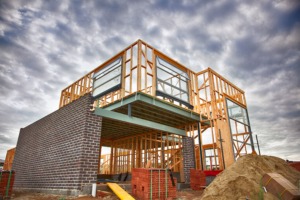
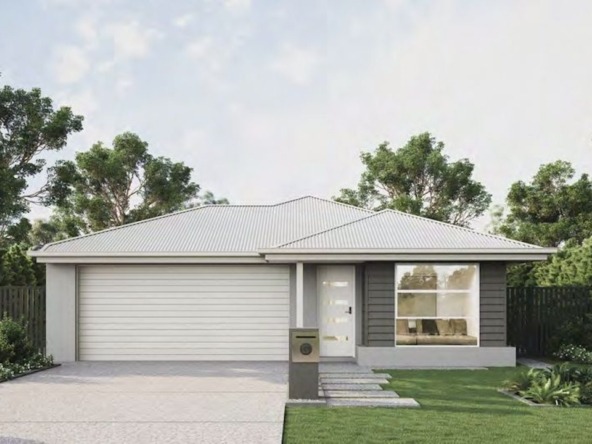
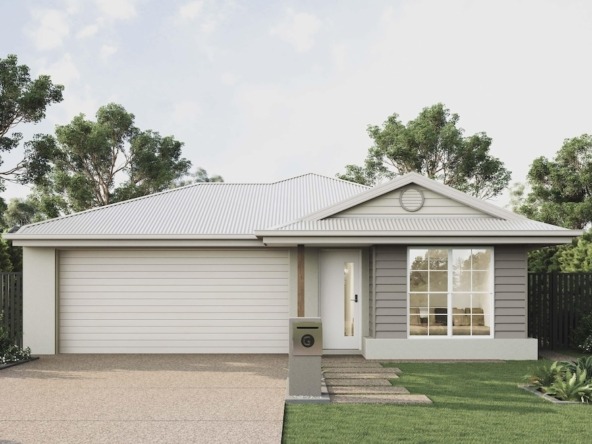
What defines a turn-key property? Turn-key investment properties are those fully equipped with all necessary items such as window coverings, fences, landscaping, driveways, paths, and clotheslines, making them ‘Ready to Rent’ upon completion. This contrasts with standard builds where the builder constructs only the house’s basic structure, leaving other elements for the homeowner to finish post-handover. This often results in a significantly lower per square metre construction cost compared to turn-key properties.
For investors, turn-key projects are the preferred choice. These projects offer numerous advantages, notably a fully completed property at handover and a single contact point for any future issues.
How do we collate our data? The data for this report is compiled from properties listed on www.latitudeproperty.com.au. We have analysed over 6900 brand new turn-key investments from across Australia to create this thorough report. In instances where there are insufficient property types or representation in certain states and territories to provide a comprehensive analysis, we have omitted them from the results.
Construction Cost M2 by property type:
Australia
- Dual Key: $2234.57 per m²
- Dual Occupancy: $2492.10 per m²
- Duplex: $2344.37 per m²
- House and Land: $2227.28 per m²
- NDIS: $2805.04 per m²
- Rooming House: $2696.87 per m²
- Terrace/Villas: $2578.44 per m²
- Town House/Unit: $2073.57 per m²
New South Wales (NSW)
- Dual Key: $2941.44 per m²
- Dual Occupancy: $2616.57 per m²
- Duplex: $2393.37 per m²
- House and Land: $2403.20 per m²
- NDIS: $3299.03 per m²
- Town House/Unit: $4492.74 per m²
Northern Territory (NT)
- House and Land: $2821.18 per m²
Queensland (QLD)
- Dual Key: $2245.90 per m²
- Dual Occupancy: $2373.14 per m²
- Duplex: $2243.29 per m²
- House and Land: $2131.08 per m²
- NDIS: $2836.98 per m²
- Rooming House: $2696.87 per m²
- Terrace/Villas: $2667.56 per m²
South Australia (SA)
- House and Land: $2380.69 per m²
- NDIS: $2928.52 per m
Tasmania (TAS)
- House and Land: $3445.93 per m²
Victoria (VIC)
- Dual Key: $1881.13 per m²
- House and Land: $2232.29 per m²
- NDIS: $2686.31 per m²
- Terrace/Villas: $2400.21 per m²
Western Australia (WA)
- Dual Occupancy: $2483.62 per m²
- House and Land: $2665.08 per m²
When we compare the quarterly changes we see some construction cost trends between December 2023 and March 2024 for the same property types, here are the insights:
Nationwide Trends (Australia)
Dual Key: The construction cost increased from $2155.27 to $2234.57 per m².
Dual Occupancy: A slight rise in construction costs from $2468.57 to $2492.10 per m²
Duplex: A marginal increase from $2321.02 to $2344.37 per m²
House and Land: There’s a significant decrease from $2511.66 to $2227.28 per m².
NDIS: A minor decrease from $2837.29 to $2805.04 per m².
Terrace/Villas: The increase from $2410.76 to $2578.44 per m²
State-Specific Observations, December 2023-March 2024
NSW (New South Wales)
Dual Occupancy: A noticeable increase from $2574.35 to $2616.57 per m².
Duplex: A slight increase from $2351.11 to $2393.37 per m².
House and Land: A small decrease from $2465.67 to $2403.20 per m²
NDIS: The cost nearly held steady, moving from $3305.20 to $3299.03 per m².
QLD (Queensland)
Dual Key: A modest increase from $2277.70 to $2245.90 per m².
Dual Occupancy: Construction costs remained almost constant, with a minor increase from $2372.41 to $2373.14 per m².
Duplex: A slight decrease from $2255.83 to $2243.29 per m².
House and Land: A minimal increase from $2123.90 to $2131.08 per m².
NDIS: A slight increase from $2752.21 to $2836.98 per m².
VIC (Victoria)
Dual Key: The construction cost remained steady at $1881.13 per m².
House and Land: A slight decrease from $2867.05 to $2232.29 per m².
NDIS: A minor decrease from $2745.03 to $2686.31 per m².
Terrace/Villas: A slight decrease from $2423.85 to $2400.21.
Insights
Increased Costs: In general, the majority of property types across Australia and in specific states saw a slight to moderate increase in construction costs, likely due to inflationary pressures on materials and labour.
Decreased Costs: Notably, House and Land properties in Australia and VIC saw significant decreases in construction costs, which could be due to efficiencies gained, reduced material costs, or competitive pressures in the construction industry.
Stable Costs: In some cases, such as the Dual Key in VIC, construction costs remained remarkably stable, indicating a steady market without significant fluctuations in the cost inputs.
These trends in construction costs reflect various factors at play, including economic conditions, material costs, labour availability, and regional differences. Investors and stakeholders in the real estate and construction sectors should consider these factors when planning projects or investments.
Developed Land Cost M2 by State:
NSW (New South Wales): $1,115 M2
NT (Northern Territory): $507 M2
QLD (Queensland): $861 M2
SA (South Australia): $700 M2
TAS (Tasmania): $619 M2
VIC (Victoria): $1,178 M2
WA (Western Australia): $732 M2
Developed Land Cost M2 by State/Region:
New South Wales (NSW)
Ballina Shire, Cumbalum: $1000.00 per m²
Central Coast, Crangan Bay: $950.00 per m²
Central Coast, Hamlyn Terrace: $1220.56 per m²
Central Coast, Wadalba: $1031.64 per m²
Central Coast, Warnervale: $1145.40 per m²
Central Coast, Woongarrah: $1435.67 per m²
Central Coast, Wyee: $980.20 per m²
Central Coast Region, Berkeley Vale: $1386.96 per m²
Central Coast Region, Crangan Bay: $922.72 per m²
Central Coast Region, Hamlyn Terrace: $1150.75 per m²
Central Coast Region, Wadalba: $1106.19 per m²
Central Coast Region, Warnervale: $1172.69 per m²
Central Coast Region, Woongarrah: $1400.00 per m²
Central Coast Region, Wyee: $980.00 per m²
City of Campbelltown, Gregory Hills: $1481.48 per m²
City of Campbelltown, Ingleburn: $1000.00 per m²
City of Newcastle, Cameron Park: $1137.93 per m²
City of Newcastle, Fletcher: $1127.66 per m²
City of Newcastle, Maryland: $1250.00 per m²
City of Newcastle, Wallsend: $1433.33 per m²
Coffs Harbour, Korora: $600.00 per m²
Lake Macquarie City, Various: Ranges from $841.27 to $1088.50 per m²
Liverpool, Various Areas: Ranges from $1020.41 to $1269.23 per m²
Newcastle, Various Areas: Ranges from $1047.62 to $1187.50 per m²
Penrith City, Various Areas: Ranges from $766.67 to $1250.00 per m²
Port Macquarie-Hastings, Various Areas: $770.83 per m²
Victoria (VIC)
Bacchus Marsh, Maddingley: $824.99 per m²
Ballarat, Various Areas: Ranges from $651.78 to $840.91 per m²
Brimbank, Various Areas: Ranges from $783.33 to $1250.00 per m²
Cardinia, Officer: $818.18 per m²
Casey, Various Areas: Ranges from $917.43 to $951.22 per m²
City of Greater Geelong: Ranges from $610.57 to $744.68 per m²
City of Hume, Various Areas: Ranges from $875.00 to $940.00 per m²
City of Knox, Various Areas: Ranges from $1000.00 to $2000.00 per m²
City of Whittlesea: Ranges from $863.64 to $918.37 per m²
Frankston, Various Areas: Ranges from $550.00 to $1000.00 per m²
Geelong, Various Areas: Ranges from $445.26 to $1333.33 per m²
Greater Bendigo, Various Areas: Ranges from $538.23 to $620.63 per m²
Queensland (QLD)
Brisbane, Various Areas: Ranges from $997.17 to $2140.00 per m²
Cairns, Various Areas: Ranges from $575.76 to $769.23 per m²
Gold Coast, Various Areas: Ranges from $944.44 to $1100.00 per m²
Ipswich, Various Areas: Ranges from $454.55 to $641.03 per m²
Logan, Various Areas: Ranges from $869.57 to $1041.67 per m²
Moreton Bay, Various Areas: Ranges from $802.92 to $925.93 per m²
Sunshine Coast, Various Areas: Ranges from $800.00 to $1050.00 per m²
Toowoomba, Various Areas: Ranges from $225.00 to $367.38 per m²
Townsville, Condon: $514.59 per m²
Western Downs Region, Chinchilla: $78.32 per m²
Western Australia (WA)
Perth, ANKETELL: $884.44 per m²
Perth, ELLENBROOK: $736.51 per m²
South Australia (SA)
Adelaide, Various Areas: Ranges from $561.88 to $1706.44 per m²
Adelaide City, Mount Barker: $540.04 per m²
Adelaide Plains, Angle Vale: $574.88 per m²
City of Playford, Various Areas: Ranges from $366.14 to $560.00 per m²
City of Salisbury, Salisbury Downs: $837.70 per m²
Mount Barker, Mount Barker: $517.65 per m²
Statewide, SMITHFIELD: $577.35 per m²
The March 2024 issue of Latitude Property’s Quarterly Report provides a comprehensive analysis of the Australian real estate market, focusing on construction costs per square meter (m²) and land costs across various states and regions. Turn-key investment properties, fully equipped and ready for rental upon completion, are the primary focus, offering insights valuable for investors navigating the property sector.
The report begins by defining turn-key properties and their advantages, emphasising their appeal to investors due to convenience and a single point of contact for post-handover issues. Data for the report is compiled from over 6900 new turn-key investments listed on Latitude Property’s website, offering a thorough examination of market trends.
Construction costs per m² vary by property type and region. Nationwide trends show a general increase in construction costs, attributed to inflationary pressures on materials and labor. However, notable decreases are observed in House and Land properties, indicating potential efficiencies or competitive pressures in the construction industry.
State-specific observations highlight fluctuations in construction costs across New South Wales, Queensland, Victoria, and other regions. While some areas experience modest increases, others see steady or even decreased costs. These trends reflect a combination of economic conditions, material costs, and regional dynamics, influencing investor decisions and project planning.
The report also delves into land costs per m² across different states and regions, providing a comprehensive overview for potential investors. Land costs exhibit significant variations, influenced by factors such as location, demand, and development activity.
In summary, Latitude Property’s Quarterly Report for March 2024 offers valuable insights into the Australian real estate market, equipping investors with essential information to make informed decisions amidst fluctuating construction and land costs. By understanding these trends and regional dynamics, stakeholders can navigate the property sector effectively, maximizing opportunities and mitigating risks.
As the property market continues to evolve, Latitude Property Australia remains committed to providing insightful and up-to-date information to support our investors in making informed decisions.
If you would like more information on our properties, please visit our website www.latitudeproperty.com.au
If you intend to utilise this report in part or whole, please ensure to credit us appropriately. “Source: Latitude Property Quarterly Report, March 2024,” and include a link to our website www.latitudeproperty.com.au
Disclaimer: Please note that the data presented in this report, including the average build costs per square meter (m²) for various property types across different states, is based on available information and is intended to provide a general overview of market trends as of December 2023.
While every effort has been made to ensure the accuracy and completeness of the data, Latitude Property does not guarantee its absolute precision. The information is derived from sources believed to be reliable; however, it may not be exhaustive, and its accuracy cannot be assured. The data may also be subject to revisions or updates.
Variations in the data might occur due to factors such as incomplete data entries, variations in reporting standards, and unreported changes in market conditions.
This report should not be considered as the sole basis for any investment or financial decisions. Users of this report are advised to conduct their own due diligence and consult with professional advisors before making any property investment or financial decisions.
Latitude Property disclaims any liability for any loss or damage of any kind arising out of the use of, or reliance on, the information provided in this report.